
This article still on progress.
This article is part of my project for Applied Data Science Capstone. Please also check the main repository of the project.
Introduction/Business Problem #
Since 2020, pandemics change many things in our lives, everything would be different especially if it is related to health and medicine.
For anyone that has a plan to move to the new city, one of the top questions that would be searched is how far the place is from the medical facilities and what type of medical facilities is available in that neighbourhood.
Through this capstone project, I will be analyzing medical venues in the neighbourhoods of New York City, with the support information from the Foursquare data.
This project would be valuable for anyone that lives and work (also for anyone that plans to live or work) in the neighbourhoods of New York City.
Data #
Here’s the data which was used in this capstone project.
- New York City Boroughs and Neighbourhoods data. The data were already available through the course and also available from data gov as Borough Boundaries [4].
- Foursquare API explore endpoint [1] to get medical venues for every borough listed on the New York City dataset.
We focus on 5 boroughs of New York City.
Methodology #
In this project we are trying to analyze medical facilities in 5 boroughs of New York City.
In the first step we have collected the following data:
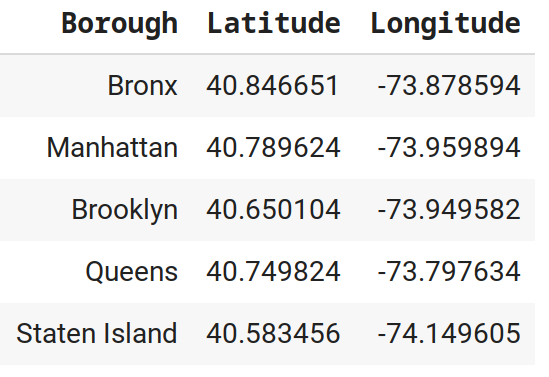
- Neighbourhoods from 5 boroughs with the latitude and longitude coordinate.
- To get the coordinates of 5 boroughs we use geopy Python library.
The second step in our analysis will be getting venues with category Medical Center from Foursquare:
- Our first approach actually gets 100 Top venues for every neighbourhood, but the result of Foursquare API returns empty for several neighbourhoods.
- On the second approach, we use borough level, to get 100 Top venues for every borough.To keep it revelan to this project topic which is “the battle of the neighbourhoods”, we try to map the venue’s location back to the neighbourhood level. The mapping process based on the distance of the venue to the (center of) neighbourhood coordinate.
We decided to set the radius to 5000 meters (5 kilometers), with the objective to get 100 top medical center venues for all 5 boroughs.
| Borough | Total Venues in Range | Total Top Venues in Range |
|---|---|---|
| Bronx | 182 | 100 |
| Manhattan | 274 | 100 |
| Brooklyn | 215 | 100 |
| Queens | 181 | 100 |
| Staten Island | 160 | 100 |
Manhattan has the most medical center venues (274) in range of 5 KM.
Related to the distance calculation of from the venues to the nearest neighbourhoods, we use Haversine formula [7] to determine the great-circle distance between two points on a sphere given their latitude and longitude. This formula is not the most precise calculation for the great-circle (earth) problem, because there are several assumptions. For this analysis we assume the earth radius is 6371 km.
We implement the haversine formula as a python function and the calculation process happened on the pandas dataframe.
Results and Discussion #
During the analysis, five clusters were defined.
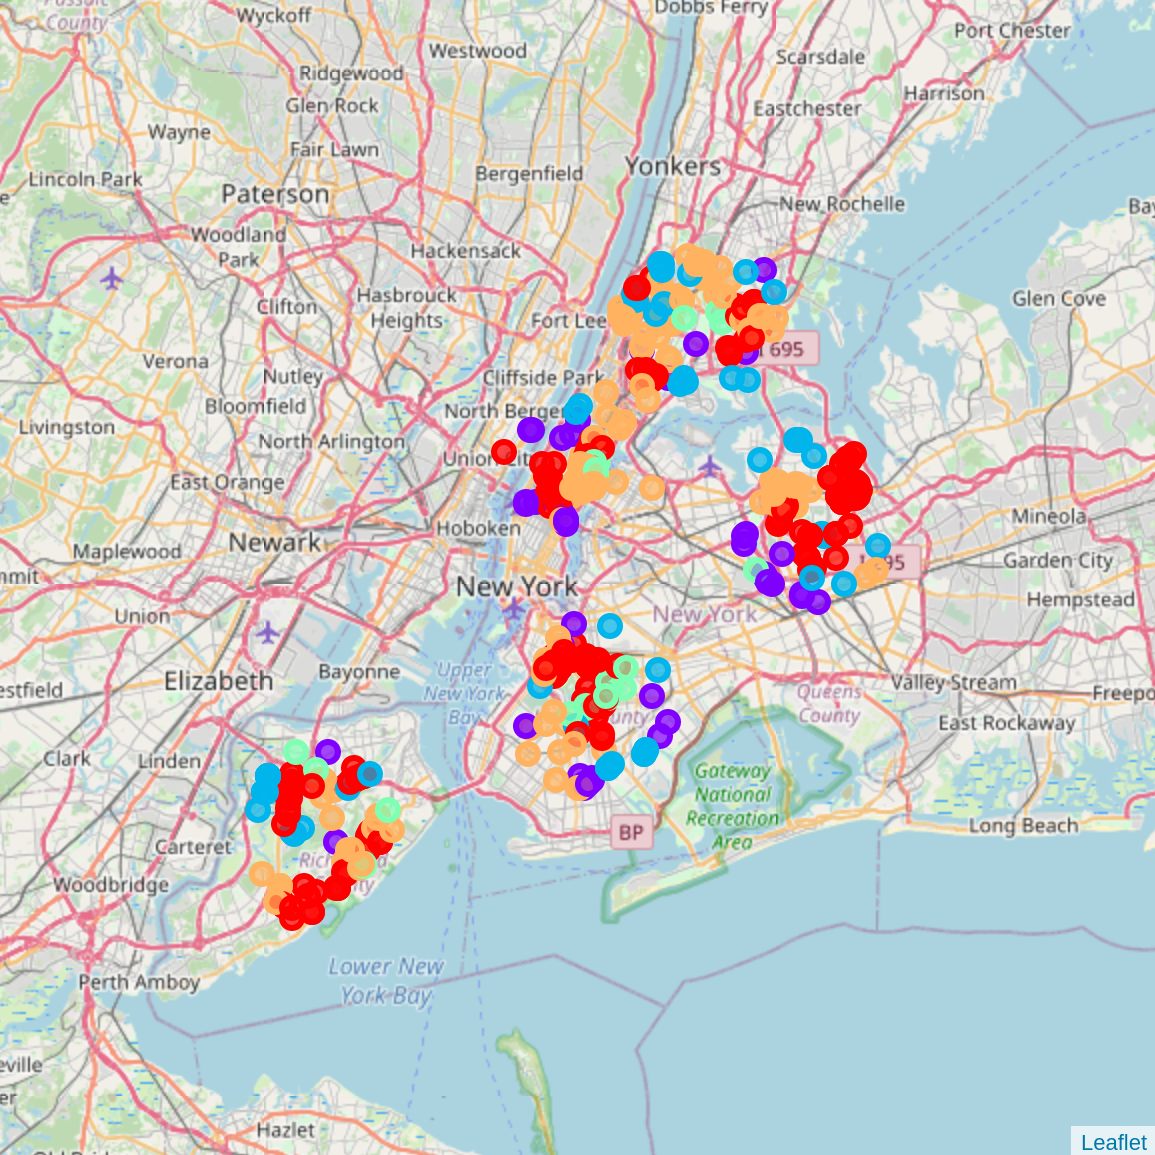
- Cluster with red points: Doctor’s Office
- The red cluster consists of 194 points.
- This cluster is the biggest clusters (even though the total venue almost similar to cluster Mix)
- Cluster with purple points: Medical Center
- The purple cluster consists of 43 points.
- Cluster with blue points: Doctor’s Office (Veterinarian)
- The blue cluster consists of 55 points.
- Cluster with green points: Hospital
- The green cluster consists of 25 points.
- This cluster is the smallest one.
- Cluster with orange points: Mix (Doctor’s Office/Hospital/Medical Center)
- The orange cluster consists of 183 points.
- This cluster is one of the biggest clusters (with a total venue almost similar to cluster Medical Center).
Conclusion #
To conclude, the basic data analysis was performed to identify medical facilities in neighbourhoods of New York City.
Areas of Improvement #
- Add New York Health Center Districts Dataset [5] to improve analysis quality.
- We could include more New York City Boroughs, other than 5 boroughs that have been used in this report: Bronx, Manhattan, Brooklyn, Queens, Staten Island.
- We have not analyzed the Medical Center public ratings, because it is hard to find the dataset.
Reference #
- Foursquare explore endpoint. https://developer.foursquare.com/docs/api-reference/venues/explore/
- Foursquare venue categories. https://developer.foursquare.com/docs/build-with-foursquare/categories
- List of US cities by population. https://en.wikipedia.org/wiki/List_of_United_States_cities_by_population
- City of New York Borough Boundaries. https://catalog.data.gov/dataset/borough-boundaries
- City of New York Health Center Districts. https://catalog.data.gov/dataset/health-center-districts
- NYC Health + Hospitals, officially the New York City Health and Hospital Corporation (NYCHHC). https://en.wikipedia.org/wiki/NYC_Health_%2B_Hospitals
- Haversine formula. https://en.wikipedia.org/wiki/Haversine_formula
- Main repository of the project. https://github.com/oonid/Coursera_Capstone/tree/main/The_Battle_of_Neighborhoods.
Title Image courtesy of Wikipedia NYC Health + Hospitals.